Finally, the numbers are all complete and the rankings are in.
The 10th annual NFL Franchise Rankings are ready for your viewing pleasure. We have tabulated the latest figures after the 2010 Playoffs and Super Bowl 45.
Why did we do this?
To recap, a few years ago, a good strong listener asked me to rank the franchises from #32 to #1 based on their accomplishments from Super Bowl I to present.
So I did. I wanted it to be objective, not subjective. I wanted it to be a formula and you would just enter the numbers and it would spit out the rankings with no favoritism or prejudice. We have been doing this since 2001. Since then, it has been imitated a time or two , but I don’t mind. It is pretty obvious idea for any sports nerd to come up with.
Here is how it works. Each Franchise gets 1 point for each season it makes the playoffs. Then, if it reaches the Conference Championship Game it gets a total of 3 points. If it makes the Super Bowl it gets 5, and if it wins the Super Bowl it wins the maximum total of points in a given year of 11. It used to be 10 for the Super Bowl, but I have adjusted it last year because I didn’t like the idea that 2 Super Bowl losses equaled a Super Bowl win. So, Now 11 points for a win and 5 for a loss in the Super Bowl.
I have been asked why no points are given for wins in the Wildcard round, but I decided that would not make sense with the idea that the playoffs have grown over the years and there is no way to equalize a smaller field to a larger one. Also, a Wildcard win is not that big a deal anymore with 6 teams in the playoffs, so unless you reach the Conference Title game, no additional points beyond the 1 for making the post-season.
I also have been asked how come I don’t go by average points per season (since many teams have joined the league since Super Bowl 1. My answer is simple: I don’t want to penalize teams who have been in the league all of the years. If you go by average points per year rather than total points, it is possible that the Baltimore Ravens would have been #1 if they had won the Super Bowl this year. No chance I would believe that premise, given that they didn’t exist prior to 1996. But, if a team has been established since the season of Super Bowl 1 (1966), it is notated.
Just add up the points for all the years, and that is the entire formula. (By the way, if you disagree with the point totals for each accomplishment, you will find that just about any reasonable formula spits out about the same results.
Otherwise, I break ties based on the team with more Super Bowl wins, then Super Bowl losses, then Championship Game wins, then playoff berths, and finally average points per year. There are no ties. I will settle it somehow.
We have added "average pts per year" - so that we may determine results based on years in the league. 24 of the 32 teams have been here the entire span of the 45 years of Super Bowl football, but this metric will help put the other 8 teams: Saints '67, Bengals '68, Seahawks '76, Buccaneers '76, Jaguars '95, Panthers '95, Ravens '96, and Texans '02. Also, the Browns missed 96-98, so they only have 42 seasons to work with.
Here are the Final Rankings through Super Bowl 45 - With the Cowboys barely still on top - thanks to the Steelers losing on Sunday.
Teams #1-#10
=========================================

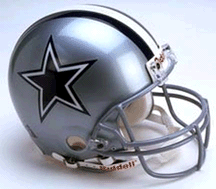
#1 - Dallas Cowboys (Last Year, #1)
Because of the results of Super Bowl 45, the Cowboys are able to stay on top of the mountain for the 10th consecutive year of these rankings. But, barely. Their once insurmountable lead in these rankings (they had a 19 point lead over San Francisco and a 32 point lead over Pittsburgh in year 1 of these rankings) is now down to 1 single point over the Steelers. Having no appearances in even the Final 4 of the NFL since their win in Super Bowl 30, this team is in desperate need of some post season success. However, they built such a huge lead that they are atop the mountain for another year.
Total Points: 108
Total Playoff Years: 66C, 67C, 68, 69, 70SL, 71S, 72C, 73C, 75SL, 76, 77S, 78SL, 79, 80C, 81C, 82C, 83, 85, 91, 92S, 93S, 94C, 95S, 96, 98, 99, 03, 06, 07, 09
P: 30
4: 8
2: 3
1: 5
Average: 2.4 points per season

#2 - Pittburgh Steelers (#2)
Steelers fans may find this hard to believe, but they still sit #2. Yes, the Steelers have 1 more Lombardi Trophy (6-5), but they trail the Cowboys in Playoff appearances (30-25), Championship Game Losses (8-7), and Super Bowl Losses (3-2). Add those slight edges together and the Steelers, who have put 35 points up in this decade, still need another point to get to #1. Based on their pace of this decade, that should not take long.
Total Points: 107
Total Playoff Years: 72C, 73, 74S, 75S, 76C, 77, 78S, 79S, 82, 83, 84C, 89, 92, 93, 94C, 95SL, 96, 97C, 01C, 02, 04C, 05S, 07, 08S, 10SL
P: 25
4: 7
2: 2
1: 6
Average: 2.37 points per season

#3 - San Francisco 49ers (#3)
The 49ers franchise has basically taken the decade off but they still sit firmly in 3rd place in the Super Bowl era. They have the distinction of being the only multi-Super Bowl winner to never lose in the big game (5-0). Otherwise, their drought is certainly not what their fan base became accustomed to in the Montana and Young eras.
Total Points: 85
Total Playoff Years: 70C, 71C, 72, 81S, 83C, 84S, 85, 86, 87, 88S, 89S, 90C, 92C, 93C, 94S, 95, 96, 97C, 98, 01, 02
P: 21
4: 7
2: 0
1: 5
Average: 1.88 points per season

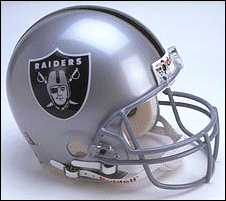
#4 - Oakland Raiders (#4)
Oddly, the Bay-area drought also has affected the Raiders. Oakland's dominance was from Super Bowl 1 until the mid-80's, and they actually have nearly the exact same credentials as the 49ers. The only difference between the two franchises is that the 49ers won all of their Super Bowls and the Raiders won 3 of the 5 (losing Super Bowl 2 to Green Bay and Super Bowl 37 to Tampa Bay). Otherwise, shocking mirror images and neither has even made the playoffs since 2002.
Total Points: 77
Total Playoff Years: 67SL, 68C, 69C, 70C, 72, 73C, 74C, 75C, 76S, 77C, 80S, 82, 83S, 84, 85, 90C, 91, 93, 00C, 01, 02SL
P: 21
4: 9
2: 2
1: 3
Average: 1.71 points per season

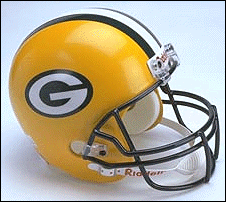
#5 - Green Bay Packers (#9 last season)
This season's big winner is Green Bay, cruising past New England, Miami, Denver, and Washington in the rankings with their win in Super Bowl 45. The Packers fan-base always question our rankings because they do arbitrarily begin at Super Bowl 1. Had these rankings been for the entire history of the NFL, their 13 NFL Titles would have them ranked significantly higher (as in #1). As it stands, they are now Top 5 in the Super Bowl era, and given their period of famine from Vince Lombardi to Brett Favre, it does show how productive their last 2 decades have been. Because they only had 1 point in the 70's and 1 point in the 80's.
Total Points: 65
Total Playoff Years: 66S, 67S, 72, 82, 93, 94, 95C, 96S, 97SL, 98, 01, 02, 03, 04, 07C, 09, 10S
P: 17
4: 2
2: 1
1: 4
Average: 1.44 points per season

#6 - New England Patriots (#5)
Speaking of teams that have accumulated most of their points recently, 44 of the Patriots points have come since we started doing these rankings a decade ago. But, what a decade it has been. They dropped back out of the Top 5 this season, but given their pace, they won't be out long. 3 out of 6 in their Super Bowl appearances.
Total Points: 61
Total Playoff Years: 76, 78, 82, 85SL, 86, 94, 96SL, 97, 98, 01S, 03S, 04S, 05, 06C, 07SL, 09, 10
P: 17
4: 1
2: 3
1: 3
Average: 1.35 points per season

#7 - Miami Dolphins (#6)
Another industry leader for the 1970's and on through the Dan Marino era, the Dolphins have had a very quiet decade, and therefore have fallen out of the Top 5 since our rankings have begun. Their last world Title was in 1973 at Super Bowl VIII.
Total Points: 58
Total Playoff Years: 70, 71SL, 72S, 73S, 74, 78, 79, 81, 82SL, 83, 84SL, 85C, 90, 92C, 94, 95, 97, 98, 99, 00, 01, 08
P: 22
4: 2
2: 3
1: 2
Average: 1.28 points per season

# 8 - Denver Broncos (#7)
It is certainly shocking to consider that the Broncos have missed the playoffs since 2005. Another team with 6 appearances in the Super Bowl and a very solid Top 10 franchise as the group that they run in is very tightly bunched together.
Total Points: 57
Total Playoff Years: 77SL, 78, 79, 83, 84, 86SL, 87SL, 89SL, 91C, 93, 96, 97S, 98S, 00, 03, 04, 05C
P: 17
4: 2
2: 4
1: 2
Average: 1.26 points per season

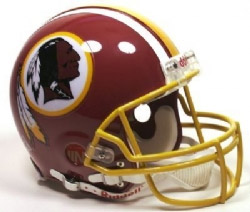
#9 - Washington Redskins (#8)
The Redskins are an interesting study because they have the fewest playoff appearances of any team in the top 12. Just 16 times have they been in the NFL post season (10 fewer playoff appearances than Minnesota), but they hold the distinction of 3 Super Bowl titles in a decade with 3 different starting QBs.
Total Points: 56
Total Playoff Years: 71, 72SL, 73, 74, 76, 82S, 83SL, 84, 86C, 87S, 90, 91S, 92, 99, 05, 07
P: 16
4: 1
2: 2
1: 3
Average: 1.24 points per season

#10 - Indianapolis/Baltimore Colts (#10)
The final team in our Top 10, the Colts are a team that has plenty of tradition. I would have to imagine that we all saw more World Titles in the Peyton Manning era than we have seen to this point, but he has a few more years to add to his Super Bowl 41 crown.
Total Points: 54
Total Playoff Years: 68SL, 70S, 71C, 75, 76, 77, 87, 95C, 96, 99, 00, 02, 03C, 04, 05, 06S, 07, 08, 09SL, 10
P: 20
4: 3
2: 2
1: 2
Average: 1.2 points per season
The Rest of the Rankings
================================
See Teams 11-20 Here
See Teams 21-32 Here

1 comment:
It would be interesting to see how the average points per year has played out historically. If my math is right, the Cowboys were at a peak of 3.37 points per season after Super Bowl 30. That means, at a 3.37 average, a Cowboys appearance in the Conference Championship without advancing to the Super Bowl during those first 30 Super Bowl seasons would have constituted a subpar season. Of course, expectations have tempered a bit in the last 15 years.
Post a Comment